Joshua Shinavier | Anything To Graph
KGC | All Access Subscription
•
17m
Show me your schemas, and I will show you a graph! Although graph databases have become very popular in the enterprise, deep expertise in graphs is still in short supply (see "Building an Enterprise Knowledge Graph @Uber: Lessons from Reality" from KGC 2019). Developers often think of graphs as a completely different kind of thing from the rest of their company's data, and will go to great lengths to force their data into a "graph" shape. The amount of manual effort involved in building and maintaining ETL pipelines can become a bottleneck and a maintenance burden. In fact, there is usually a rich domain data model of entities, relationships, and properties which is already implicit in the company's existing schemas, be they interface descriptions for microservices, relational schemas, or various other kinds of storage schemas. Taking advantage of these schemas, and mapping conforming data into the graph, ought to require relatively little extra work, but developers need appropriate tools. In this presentation, we will illustrate such mappings with real-world examples from Uber, as well as introducing formal techniques for schema and data migration. We will also look ahead to the emerging GQL standard as the foundation for a new generation of highly interoperable graph database tools.
Building an enterprise Knowledge Graph is very daunting at first simply due to the sheer volume and the fact that people often think that knowledge graphs are different from the other data produced within a company. Here today is Joshua Shinavier who is to talk about a unified way to mapping to a graph and how there are challenges to heterogeneity in the graph.
Knowing all of the challenges, Joshua recommends that the data must conform to a schema and that the data must be consistent using identifiers and there has to be some degree of standardization. This leads to him talking about desirable characteristics for graphs and he emphasizes that complexity of the graph is now the answer. #knowledgegraphs #knowledgegraphconference #knowledgegraphschema #howtobuildknowledgegraphs
Up Next in KGC | All Access Subscription
-
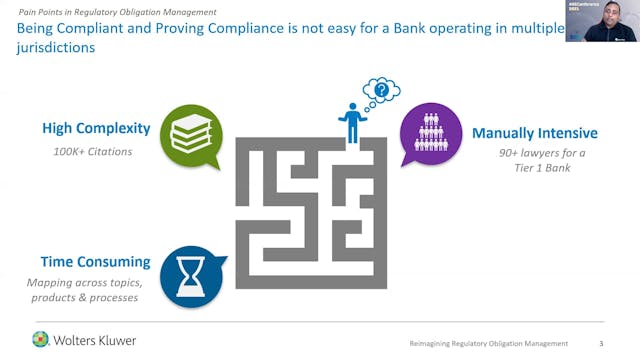
Abhishek Mittal | Re-Imagining Regula...
Content Enrichment: Development and deployment of a 5-stage taxonomy. Applying the taxonomy to tag regulations and classify them for improved discovery & work assignment.
Smart Authoring: Leveraging advanced NLP and ML techniques to learn from the past content authoring for identification of ... -
Jonas Almeida | Data Commons In The W...
The increasing reliance on distributed epidemiological data sources for time sensitive analysis defines an emergent computational commons space: API ecosystems supporting epidemiology data commons. This space has been forced to evolve significantly to meet the real-time requirements of COVID-19 i...
-
KGC 2021 Overview


